601 線形計画法
\begin{align}
\text{minimize } c^Tx & \\
\text{subject to } Ax &\le b \\
\text{where } & A \in R^{n \times m}_+, \\
& x \in R^m_{++}, \\
& b \in R^n_+, \\
& c \in R^m_+.
\end{align}
アプリケーション:トンコケ丼
- 決定変数:トンコケ丼の数\(x_1\)杯,コケトン丼の数\(x_2\)杯,ミックス丼の数\(x_3\)杯
- 目的関数:利益最大化 トンコケ丼 1500円/杯,コケトン丼 1800円/杯,ミックス丼 3000円/杯
- 制約式:材料 豚肉60 \(\times 10^2\)g/day,鶏肉60 \(\times 10^2\)g/day,牛肉20 \(\times 10^2\)g/day,
\begin{align}
\text{maximize } 15x_1 + 18x_2 + 30x_3,& \\
\text{subject to } 2x_1 +x_2 + x_3 &\le 60, \\
x_1 +2x_2 + x_3 &\le 60, \\
x_3 &\le 30, \\
x_1,x_2,x_3 &\ge 0, \\
\text{where } A =\begin{bmatrix}
2 & 1 & 1 \\
1 & 2 & 1 \\
0 & 0 & 1
\end{bmatrix}, \\
x = \begin{bmatrix}
x_1 \\
x_2 \\
x_3
\end{bmatrix}, \\
b = \begin{bmatrix}
60 \\
60 \\
30
\end{bmatrix}, \\
c = \begin{bmatrix}
15 \\
18 \\
30
\end{bmatrix}.
\end{align}
読み込み
In [1]:
import sympy as sy
import numpy as np
import multiprocessing as mp

import gurobipy as gp

import pandas as pd
import matplotlib.pyplot as plt
from mpl_toolkits.mplot3d import Axes3D
% matplotlib inline

import warnings
warnings.filterwarnings("ignore")
LP不等式標準形のテンプレートを用意
In [2]:
n = 3
m = 3
A = sy.Matrix(n, m, sy.symbols('A:{}:{}'.format(n, m)))
x = sy.Matrix(m, 1, sy.symbols('x:{}:1'.format(m)))
b = sy.Matrix(n, 1, sy.symbols('b:{}:1'.format(n)))
c = sy.Matrix(m, 1, sy.symbols('c:{}:1'.format(m)))

objective_function = c.T*x
constraints = A*x-b

display(A, x, b, c, objective_function, constraints)
Matrix([
[A00, A01, A02],
[A10, A11, A12],
[A20, A21, A22]])
Matrix([
[x00],
[x10],
[x20]])
Matrix([
[b00],
[b10],
[b20]])
Matrix([
[c00],
[c10],
[c20]])
Matrix([[c00*x00 + c10*x10 + c20*x20]])
Matrix([
[A00*x00 + A01*x10 + A02*x20 - b00],
[A10*x00 + A11*x10 + A12*x20 - b10],
[A20*x00 + A21*x10 + A22*x20 - b20]])
具体的なパラメータの挿入
In [3]:
def assign_parameter(arg):
    nn, mm, name = arg
    return ('{}{}{}'.format(name, nn, mm), param_dict[name][nn][mm])

def make_matrix_parallel(func, position_lists):
    pool = mp.Pool(processes=mp.cpu_count() - 1)
    res_list = pool.map(func, position_lists)
    pool.close()
    pool.join()
    return res_list

param_dict = {}
param_dict['A'] = [[2, 1, 1],
                   [1, 2, 1],
                   [0, 0, 1]]
param_dict['b'] = [[60],
                   [60],
                   [30]]
param_dict['c'] = [[15],
                   [18],
                   [30]]

position_lists = [(nn, mm, 'A') for nn in range(n) for mm in range(m)]+[(nn, 0, 'b') for nn in range(n)]
constr_params = make_matrix_parallel(assign_parameter, position_lists)
obj_params = make_matrix_parallel(assign_parameter, [(mm, 0, 'c') for mm in range(m)])

constraints_with_param = constraints.subs(constr_params)
objective_with_param = objective_function.subs(obj_params)

display(objective_with_param, constraints_with_param)
Matrix([[15*x00 + 18*x10 + 30*x20]])
Matrix([
[2*x00 + x10 + x20 - 60],
[x00 + 2*x10 + x20 - 60],
[              x20 - 30]])
LPモデル構築
In [4]:
model = gp.Model('Tonkoke')

for var_name in x:
    model.addVar(lb=0, ub=gp.GRB.INFINITY, name=str(var_name))
model.update()

for const in constraints_with_param:
    lhs = gp.LinExpr(0)
    #Only work for linear expression
    for key, value in const.as_coefficients_dict().items():
        if key not in x:
            lhs += value
        else:
            lhs.add(model.getVarByName(str(key)), value)
    model.addConstr(lhs, gp.GRB.LESS_EQUAL, 0, name='')

obj = gp.LinExpr(0)
for key, value in objective_with_param[0].as_coefficients_dict().items():
    if key not in x:
        obj += value
    else:
        obj.add(model.getVarByName(str(key)), value)
model.setObjective(obj, gp.GRB.MAXIMIZE)

model.update()

output_file = 'tonkoke.lp'
model.write(output_file)
print(open(output_file).read())
\ Model Tonkoke
\ LP format - for model browsing. Use MPS format to capture full model detail.
Maximize
  15 x00 + 18 x10 + 30 x20
Subject To
 R0: 2 x00 + x10 + x20 <= 60
 R1: x00 + 2 x10 + x20 <= 60
 R2: x20 <= 30
Bounds
End
最適化計算の実行
In [5]:
model.optimize()
Optimize a model with 3 rows, 3 columns and 7 nonzeros
Coefficient statistics:
  Matrix range     [1e+00, 2e+00]
  Objective range  [2e+01, 3e+01]
  Bounds range     [0e+00, 0e+00]
  RHS range        [3e+01, 6e+01]
Presolve removed 1 rows and 0 columns
Presolve time: 0.03s
Presolved: 2 rows, 3 columns, 6 nonzeros

Iteration    Objective       Primal Inf.    Dual Inf.      Time
       0    1.8000000e+03   3.750000e+00   0.000000e+00      0s
       2    1.2300000e+03   0.000000e+00   0.000000e+00      0s

Solved in 2 iterations and 0.04 seconds
Optimal objective  1.230000000e+03
可視化
並列化して値を入手
In [7]:
func_const_list = []
for const in  constraints_with_param:
    func_const_list.append(sy.lambdify(x, const, modules='numpy'))

func_obj = sy.lambdify(x, objective_with_param[0], modules='numpy')

def calc_const(arg):
    x1, x2, x3 = arg
    res = [x1, x2, x3]
    for const in func_const_list:
        res.append(const(x1, x2, x3))
    res.append(None)
    return res

def calc_obj(arg):
    x1, x2, x3 = arg
    res = [x1, x2, x3]
    res.append(func_obj(x1, x2, x3))
    return res

def calc_parallel(func, x_lists, column_list):
    df = pd.DataFrame(columns=column_list)
    pool = mp.Pool(processes=mp.cpu_count() - 1)
    tmp_df = pd.DataFrame(pool.map(func, x_lists), columns=column_list)
    pool.close()
    pool.join()
    return df.append(tmp_df)

x_min  =  0
x_max  =  50
x_delta = 1
x_lists = [ (float(x1), float(x2), float(x3))
                 for x1 in list(range(x_min, x_max, x_delta))
                 for x2 in list(range(x_min, x_max, x_delta))
                 for x3 in list(range(x_min, x_max, x_delta))
          ]
const_df = calc_parallel(calc_const, x_lists, ['x1', 'x2', 'x3', 'eq1', 'eq2', 'eq3', 'obj'])
obj_df = calc_parallel(calc_obj, x_lists, ['x1', 'x2', 'x3', 'obj'])
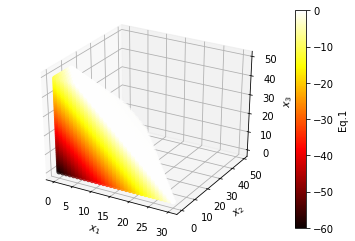
Eq.1
In [8]:
eq1 = const_df[(2*const_df.x1+const_df.x2+const_df.x3 -60 <= 0)]
fig = plt.figure()
ax = fig.add_subplot(111, projection='3d')
p = ax.scatter(eq1['x1'], eq1['x2'], eq1['x3'], c=eq1['eq1'], cmap=plt.hot())
ax.set_xlabel('$x_1$')
ax.set_ylabel('$x_2$')
ax.set_zlabel('$x_3$', rotation=90)
fig.colorbar(p, label='Eq.1')
plt.show()
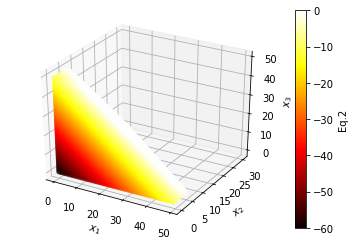
Eq.2
In [9]:
eq2 = const_df[(const_df.x1+2*const_df.x2+const_df.x3 -60 <= 0)]
fig = plt.figure()
ax = fig.add_subplot(111, projection='3d')
p = ax.scatter(eq2['x1'], eq2['x2'], eq2['x3'], c=eq2['eq2'], cmap=plt.hot())
ax.set_xlabel('$x_1$')
ax.set_ylabel('$x_2$')
ax.set_zlabel('$x_3$', rotation=90)
fig.colorbar(p, label='Eq.2')
plt.show()
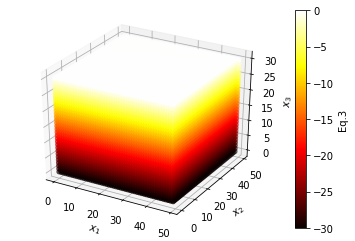
Eq.3
In [10]:
eq3 = const_df[(const_df.x3 -30 <= 0)]
fig = plt.figure()
ax = fig.add_subplot(111, projection='3d')
p = ax.scatter(eq3['x1'], eq3['x2'], eq3['x3'], c=eq3['eq3'], cmap=plt.hot())
ax.set_xlabel('$x_1$')
ax.set_ylabel('$x_2$')
ax.set_zlabel('$x_3$', rotation=90)
fig.colorbar(p, label='Eq.3')
plt.show()
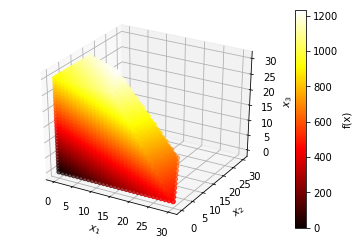
Feasible region and value of objective funciton
In [11]:
obj_value = obj_df[(2*const_df.x1+const_df.x2+const_df.x3 -60 <= 0) &
                     (const_df.x1+2*const_df.x2+const_df.x3 -60 <= 0) &
                     (const_df.x3 -30 <= 0)]
fig = plt.figure()
ax = fig.add_subplot(111, projection='3d')
p = ax.scatter(obj_value['x1'], obj_value['x2'], obj_value['x3'], c=obj_value['obj'], cmap=plt.hot())
ax.set_xlabel('$x_1$')
ax.set_ylabel('$x_2$')
ax.set_zlabel('$x_3$', rotation=90)
fig.colorbar(p, label='f(x)')
plt.show()
In [12]:
obj_value.sort_values(by='obj', ascending=False)
Out[12]:
| x1 | x2 | x3 | obj | |
|---|---|---|---|---|
| 25530 | 10.0 | 10.0 | 30.0 | 1230.0 |
| 20580 | 8.0 | 11.0 | 30.0 | 1218.0 |
| 23030 | 9.0 | 10.0 | 30.0 | 1215.0 |
| 25480 | 10.0 | 9.0 | 30.0 | 1212.0 |
| 27930 | 11.0 | 8.0 | 30.0 | 1209.0 |
| 15630 | 6.0 | 12.0 | 30.0 | 1206.0 |
| 18080 | 7.0 | 11.0 | 30.0 | 1203.0 |
| 23079 | 9.0 | 11.0 | 29.0 | 1203.0 |
| 25529 | 10.0 | 10.0 | 29.0 | 1200.0 |
| 20530 | 8.0 | 10.0 | 30.0 | 1200.0 |
| 27979 | 11.0 | 9.0 | 29.0 | 1197.0 |
| 22980 | 9.0 | 9.0 | 30.0 | 1197.0 |
| 10680 | 4.0 | 13.0 | 30.0 | 1194.0 |
| 25430 | 10.0 | 8.0 | 30.0 | 1194.0 |
| 27880 | 11.0 | 7.0 | 30.0 | 1191.0 |
| 13130 | 5.0 | 12.0 | 30.0 | 1191.0 |
| 18129 | 7.0 | 12.0 | 29.0 | 1191.0 |
| 30330 | 12.0 | 6.0 | 30.0 | 1188.0 |
| 25578 | 10.0 | 11.0 | 28.0 | 1188.0 |
| 20579 | 8.0 | 11.0 | 29.0 | 1188.0 |
| 15580 | 6.0 | 11.0 | 30.0 | 1188.0 |
| 18030 | 7.0 | 10.0 | 30.0 | 1185.0 |
| 28028 | 11.0 | 10.0 | 28.0 | 1185.0 |
| 23029 | 9.0 | 10.0 | 29.0 | 1185.0 |
| 5730 | 2.0 | 14.0 | 30.0 | 1182.0 |
| 20480 | 8.0 | 9.0 | 30.0 | 1182.0 |
| 25479 | 10.0 | 9.0 | 29.0 | 1182.0 |
| 22930 | 9.0 | 8.0 | 30.0 | 1179.0 |
| 13179 | 5.0 | 13.0 | 29.0 | 1179.0 |
| 8180 | 3.0 | 13.0 | 30.0 | 1179.0 |
| ... | ... | ... | ... | ... |
| 2601 | 1.0 | 2.0 | 1.0 | 81.0 |
| 7600 | 3.0 | 2.0 | 0.0 | 81.0 |
| 52 | 0.0 | 1.0 | 2.0 | 78.0 |
| 5051 | 2.0 | 1.0 | 1.0 | 78.0 |
| 10050 | 4.0 | 1.0 | 0.0 | 78.0 |
| 12500 | 5.0 | 0.0 | 0.0 | 75.0 |
| 7501 | 3.0 | 0.0 | 1.0 | 75.0 |
| 2502 | 1.0 | 0.0 | 2.0 | 75.0 |
| 200 | 0.0 | 4.0 | 0.0 | 72.0 |
| 2650 | 1.0 | 3.0 | 0.0 | 69.0 |
| 101 | 0.0 | 2.0 | 1.0 | 66.0 |
| 5100 | 2.0 | 2.0 | 0.0 | 66.0 |
| 2551 | 1.0 | 1.0 | 1.0 | 63.0 |
| 7550 | 3.0 | 1.0 | 0.0 | 63.0 |
| 5001 | 2.0 | 0.0 | 1.0 | 60.0 |
| 2 | 0.0 | 0.0 | 2.0 | 60.0 |
| 10000 | 4.0 | 0.0 | 0.0 | 60.0 |
| 150 | 0.0 | 3.0 | 0.0 | 54.0 |
| 2600 | 1.0 | 2.0 | 0.0 | 51.0 |
| 5050 | 2.0 | 1.0 | 0.0 | 48.0 |
| 51 | 0.0 | 1.0 | 1.0 | 48.0 |
| 7500 | 3.0 | 0.0 | 0.0 | 45.0 |
| 2501 | 1.0 | 0.0 | 1.0 | 45.0 |
| 100 | 0.0 | 2.0 | 0.0 | 36.0 |
| 2550 | 1.0 | 1.0 | 0.0 | 33.0 |
| 1 | 0.0 | 0.0 | 1.0 | 30.0 |
| 5000 | 2.0 | 0.0 | 0.0 | 30.0 |
| 50 | 0.0 | 1.0 | 0.0 | 18.0 |
| 2500 | 1.0 | 0.0 | 0.0 | 15.0 |
| 0 | 0.0 | 0.0 | 0.0 | 0.0 |
11826 rows × 4 columns